Fig. 3
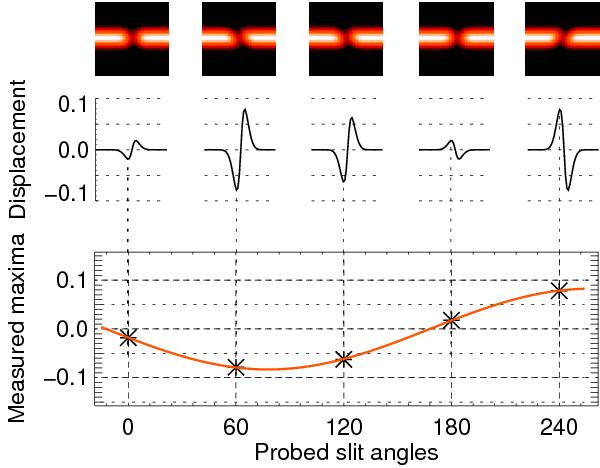
Step-by-step explanation of the position angle determination: spectra are recorded for different slit angles. Top: the 2D spectrum of one absorption line, tilted as a function of ψ. The tilts are exaggerated here in order to be visible. Middle: the position spectrum measured around the absorption line presenting the typical displacement of stellar rotation. Bottom: using the maxima of the displacement on the position spectrum, we fit a sine function whose phase is the stellar position angle. Here PAstar was set at 12°.
Current usage metrics show cumulative count of Article Views (full-text article views including HTML views, PDF and ePub downloads, according to the available data) and Abstracts Views on Vision4Press platform.
Data correspond to usage on the plateform after 2015. The current usage metrics is available 48-96 hours after online publication and is updated daily on week days.
Initial download of the metrics may take a while.