Free Access
Fig. 1
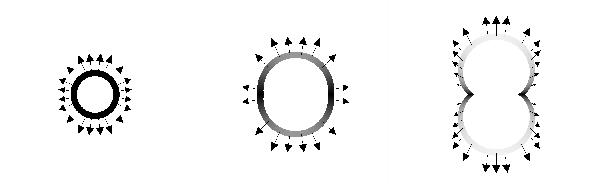
Illustration of the bipolar model for three different time parameters. Arrows indicate velocity vectors, contours the density distribution. As the time parameter evolves from left to right, the anisotropy in the bulk velocity becomes visible in the density distribution.
Current usage metrics show cumulative count of Article Views (full-text article views including HTML views, PDF and ePub downloads, according to the available data) and Abstracts Views on Vision4Press platform.
Data correspond to usage on the plateform after 2015. The current usage metrics is available 48-96 hours after online publication and is updated daily on week days.
Initial download of the metrics may take a while.