Fig. 2
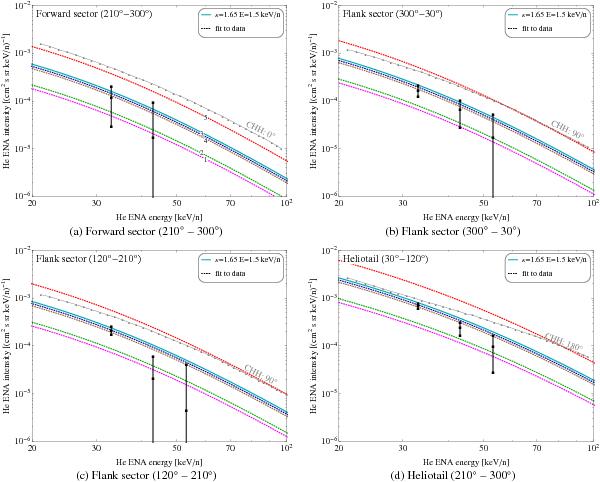
Comparison of He ENA spectral intensities obtained in present modeling with HSTOF He ENA measurements. The measurements were obtained in periods: a) forward sector in 1996–2005, b), c) both flank sectors in 1996–2010, d) tail sector in 1996–2005. Dotted color curves describe calculated He ENA spectral intensities corresponding to He ion initial spectra as described by the same color in Fig. 1. To aid identification, a numbering 1–5 is added to Fig. 2a as in Fig. 1. The solid light blue line shows the He ENA spectrum that would come out if the initial spectrum were in the form of a kappa distribution with κ = 1.65 and average He energy 1.5 keV/n. The solid gray lines with points (labeled with CHH and the value of angle from apex) correspond to previous theoretical He ENA spectra obtained by Czechowski et al. (2012).
Current usage metrics show cumulative count of Article Views (full-text article views including HTML views, PDF and ePub downloads, according to the available data) and Abstracts Views on Vision4Press platform.
Data correspond to usage on the plateform after 2015. The current usage metrics is available 48-96 hours after online publication and is updated daily on week days.
Initial download of the metrics may take a while.