Fig. 6
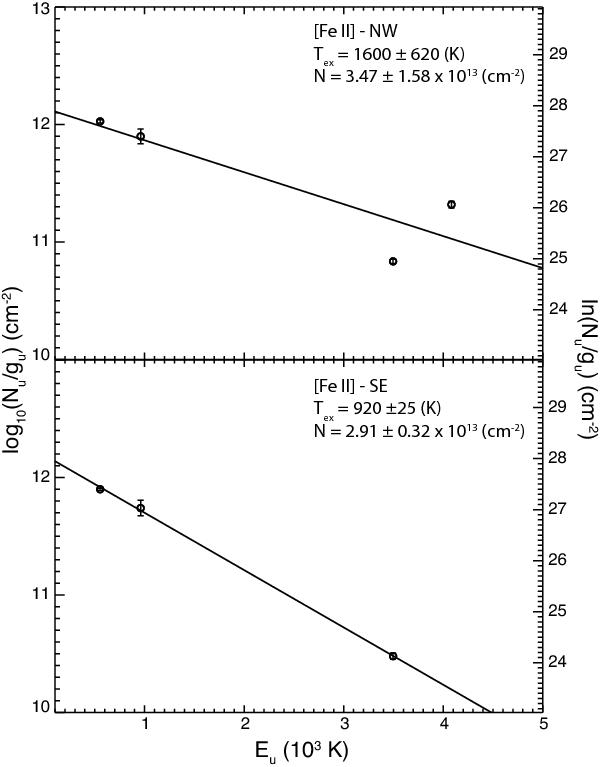
[FeII] excitation diagram for the NW and SE outflow lobes (upper and lower panels, respectively). Derived temperatures and column densities are reported in the upper right corner of each panel. The 24.5 μm line intensity at Eu ~ 4000 K is likely affected by residual bad pixel contamination; if excluded from the fit, temperatures at both positions are at ~1000 K.
Current usage metrics show cumulative count of Article Views (full-text article views including HTML views, PDF and ePub downloads, according to the available data) and Abstracts Views on Vision4Press platform.
Data correspond to usage on the plateform after 2015. The current usage metrics is available 48-96 hours after online publication and is updated daily on week days.
Initial download of the metrics may take a while.