Fig. 2
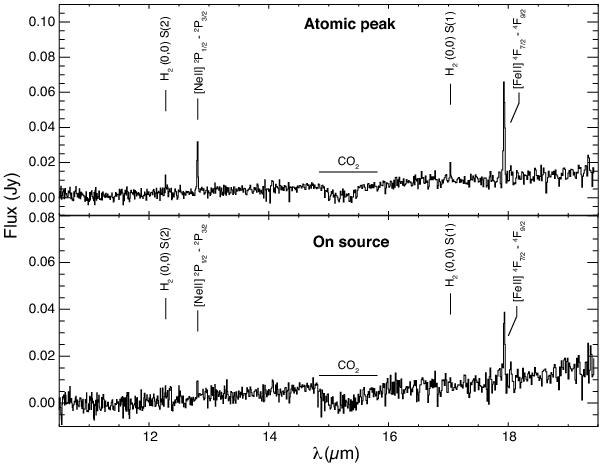
IRS spectra from the SH module (10−20 μm) corresponding to the spaxels encompassing the on-source and atomic peak positions in Fig. 1 (lower and upper panels, respectively). Both positions are dominated by strong atomic emission lines. No H2 emission is detected at the on-source spaxel. CO2 ice absorption bands are prominent in both spectra, indicating extended continuum emission to angular distances >5 ″ and a foreground absorbing layer.
Current usage metrics show cumulative count of Article Views (full-text article views including HTML views, PDF and ePub downloads, according to the available data) and Abstracts Views on Vision4Press platform.
Data correspond to usage on the plateform after 2015. The current usage metrics is available 48-96 hours after online publication and is updated daily on week days.
Initial download of the metrics may take a while.