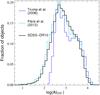
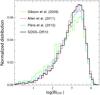
Fig. 7

Left panel: distribution of AI measured for C iv absorption troughs from Trump et al. (2006, blue histogram), SDSS-DR9 (cyan histogram, Pâris et al. 2012) and the present catalog (thick black histogram). The distributions are normalized for log AI > 3. Right panel: distribution of BI measured for the C iv absorption troughs from Gibson et al. (2009, green histogram), Allen et al. (2011, red histogram), SDSS-DR9 (cyan histogram, Pâris et al. 2012), and the present catalog (thick black histogram).
Current usage metrics show cumulative count of Article Views (full-text article views including HTML views, PDF and ePub downloads, according to the available data) and Abstracts Views on Vision4Press platform.
Data correspond to usage on the plateform after 2015. The current usage metrics is available 48-96 hours after online publication and is updated daily on week days.
Initial download of the metrics may take a while.