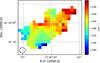
Fig. 3
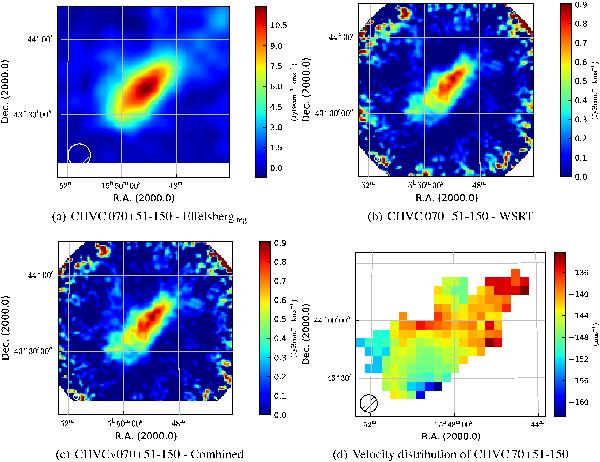
Maps of CHVC 070+51-150: a) regridded flux density map of the Effelsberg data; b) flux-density map of the WSRT data; c) the combined flux density map; and d) velocity distribution of CHVC 70+51-150 in the Effelsberg data cube. The measured velocity gradient in the Effelsberg data cube is about 15 km s-1 with a spectral resolution of 5.15 km s-1.
Current usage metrics show cumulative count of Article Views (full-text article views including HTML views, PDF and ePub downloads, according to the available data) and Abstracts Views on Vision4Press platform.
Data correspond to usage on the plateform after 2015. The current usage metrics is available 48-96 hours after online publication and is updated daily on week days.
Initial download of the metrics may take a while.