Fig. 2
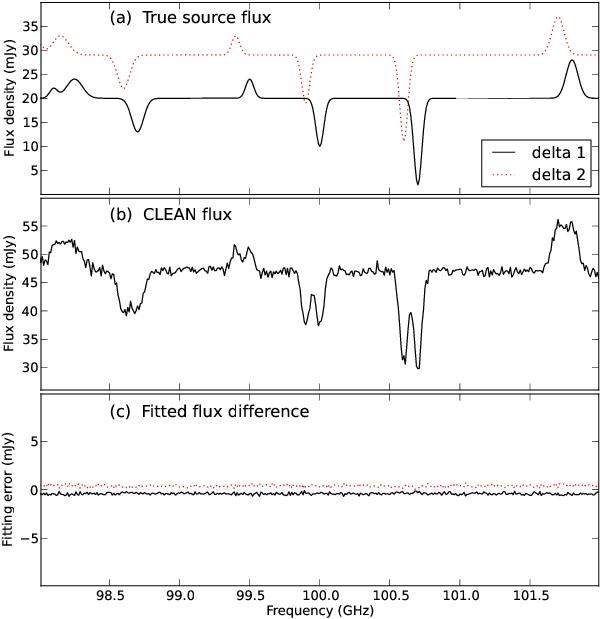
Top: model flux densities used in our simulation of two close-by point sources. Delta 1 is a point source located at the phase centre and delta 2 is a point source located 1 arcsec to the west of delta 1. Middle: spectrum of the point-like source obtained from the image deconvolution. Bottom: difference between the simulated flux densities and those fitted with UVMULTIFIT.
Current usage metrics show cumulative count of Article Views (full-text article views including HTML views, PDF and ePub downloads, according to the available data) and Abstracts Views on Vision4Press platform.
Data correspond to usage on the plateform after 2015. The current usage metrics is available 48-96 hours after online publication and is updated daily on week days.
Initial download of the metrics may take a while.