Fig. 9
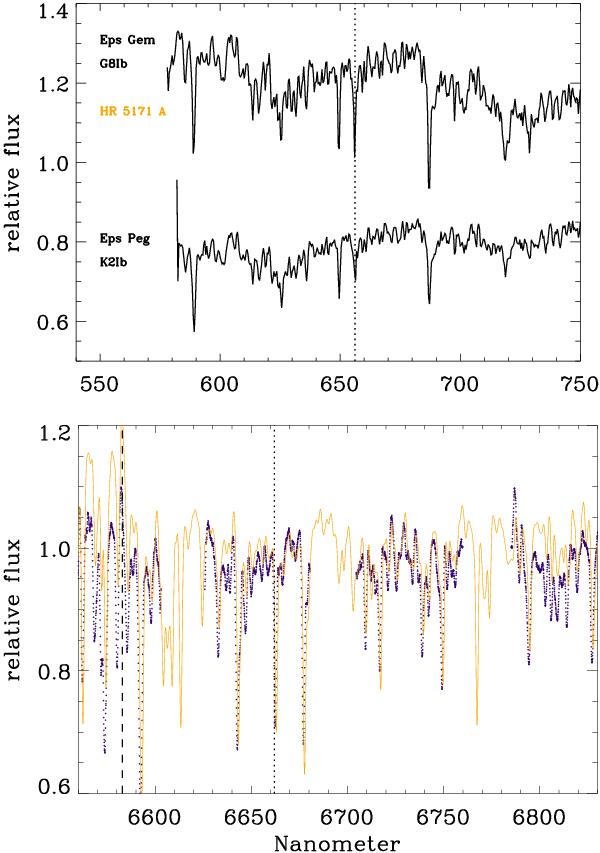
Top: comparison of the 2013 low-resolution SAAO spectrum (yellow) with two templates of similar spectral type. The spectrum of HR 5171 A is discrepant in lacking some Hα absorption (vertical dotted line). Bottom: comparison between the 1992 AAT echelle spectrum (purple dotted line) overplotted with the 2013 PUCHEROS spectrum (yellow curve). The spectra are very similar. The Hα and [N ii] λ6548 lines are indicated as vertical dotted and dashed lines, respectively.
Current usage metrics show cumulative count of Article Views (full-text article views including HTML views, PDF and ePub downloads, according to the available data) and Abstracts Views on Vision4Press platform.
Data correspond to usage on the plateform after 2015. The current usage metrics is available 48-96 hours after online publication and is updated daily on week days.
Initial download of the metrics may take a while.