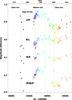
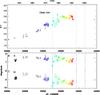
Fig. 7

Temporal evolution of HR 5171 A in several colors. The color coding for the curves involving near-IR data is the same as in Fig. 4. The B − V coming from a different dataset are shown separately, together with the corresponding B and V magnitudes. They witness a long-term trend that seems independent of any reddening variation.
Current usage metrics show cumulative count of Article Views (full-text article views including HTML views, PDF and ePub downloads, according to the available data) and Abstracts Views on Vision4Press platform.
Data correspond to usage on the plateform after 2015. The current usage metrics is available 48-96 hours after online publication and is updated daily on week days.
Initial download of the metrics may take a while.