Free Access
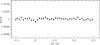
Fig. 6
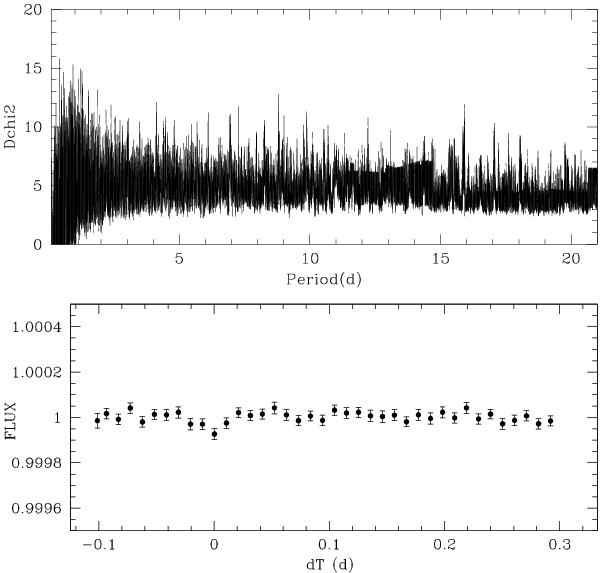
Top: transit search periodogram obtained from the analysis of the photometric residuals (Sect. 4). Bottom: Spitzer residuals folded on the ephemeris of the most significant transit signal found by our transit search algorithm (P = 0.4157 day), and binned per intervals of 15 mins.
This figure is made of several images, please see below:
Current usage metrics show cumulative count of Article Views (full-text article views including HTML views, PDF and ePub downloads, according to the available data) and Abstracts Views on Vision4Press platform.
Data correspond to usage on the plateform after 2015. The current usage metrics is available 48-96 hours after online publication and is updated daily on week days.
Initial download of the metrics may take a while.