Free Access
Fig. 5
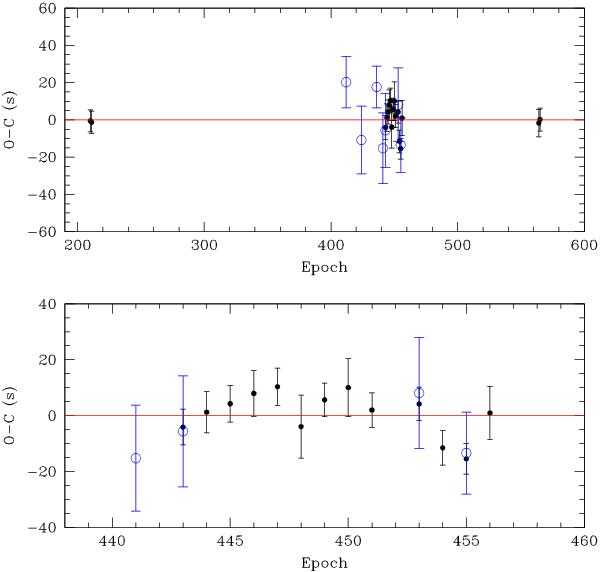
Top: transit timing variations deduced from our global analysis for the Spitzer and TRAPPIST transits (see Sect. 3.4). Bottom: zoom on the consecutive transits observed by Spitzer in April and May 2011. Three of these transits were also observed by TRAPPIST.
Current usage metrics show cumulative count of Article Views (full-text article views including HTML views, PDF and ePub downloads, according to the available data) and Abstracts Views on Vision4Press platform.
Data correspond to usage on the plateform after 2015. The current usage metrics is available 48-96 hours after online publication and is updated daily on week days.
Initial download of the metrics may take a while.