Fig. 10
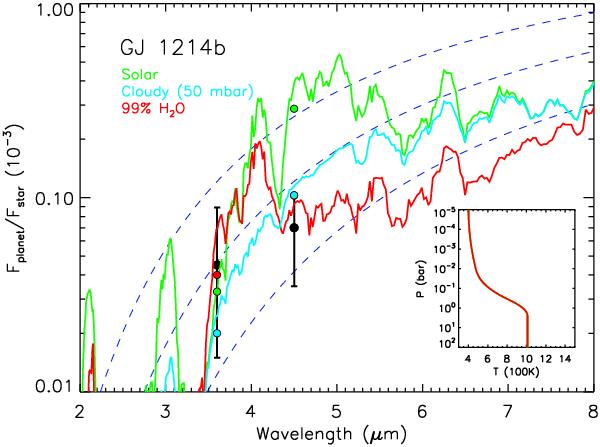
Observations and model spectra of thermal emission from GJ 1214b. The black circles with error bars show the planet-star flux ratios observed in the Spitzer IRAC bandpasses at 3.6 μm and 4.5 μm. The green and red solid curves in the main panel show model spectra of an atmosphere with a solar abundance H2-rich composition and one with a water-rich composition, respectively. The inset shows the temperature profiles for both models. The blue dashed curves show blackbody spectra of the planet with temperatures of 500 K, 600 K, and 700 K.
Current usage metrics show cumulative count of Article Views (full-text article views including HTML views, PDF and ePub downloads, according to the available data) and Abstracts Views on Vision4Press platform.
Data correspond to usage on the plateform after 2015. The current usage metrics is available 48-96 hours after online publication and is updated daily on week days.
Initial download of the metrics may take a while.