Fig. 3
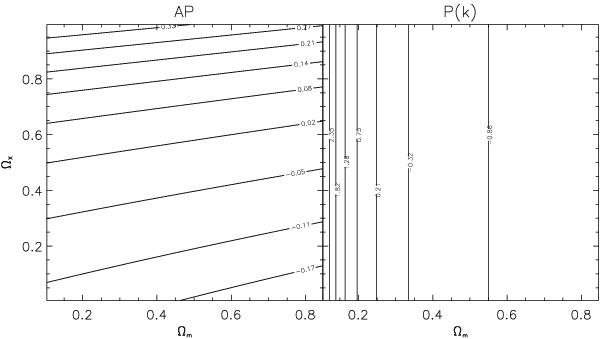
Left: isocontours of the function
 displaying the relative
variation in the galaxy clustering ratio (with respect to the best-fitting value
deduced from the analysis of SDSS DR7 data) induced by a wrong choice of the
distance-redshift conversion model (i.e. a wrong guess of the cosmological parameters
[Ωm,ΩX]). The galaxy
clustering ratio is reconstructed on the scales (R,r) = (14,42) h-1
Mpc, and its expression is approximated well by Eq. (25). The best-fitting cosmology inferred from the analysis of SDSS
DR7 data is Ωm = 0.28, ΩX = 0.45, w = −1.2. The isocontours measure the
strength of the AP geometric distortions. Right: relative variation
in the mass clustering ratio
displaying the relative
variation in the galaxy clustering ratio (with respect to the best-fitting value
deduced from the analysis of SDSS DR7 data) induced by a wrong choice of the
distance-redshift conversion model (i.e. a wrong guess of the cosmological parameters
[Ωm,ΩX]). The galaxy
clustering ratio is reconstructed on the scales (R,r) = (14,42) h-1
Mpc, and its expression is approximated well by Eq. (25). The best-fitting cosmology inferred from the analysis of SDSS
DR7 data is Ωm = 0.28, ΩX = 0.45, w = −1.2. The isocontours measure the
strength of the AP geometric distortions. Right: relative variation
in the mass clustering ratio  that results from
computing the power spectrum in the wrong cosmology.
that results from
computing the power spectrum in the wrong cosmology.
Current usage metrics show cumulative count of Article Views (full-text article views including HTML views, PDF and ePub downloads, according to the available data) and Abstracts Views on Vision4Press platform.
Data correspond to usage on the plateform after 2015. The current usage metrics is available 48-96 hours after online publication and is updated daily on week days.
Initial download of the metrics may take a while.