Fig. 2
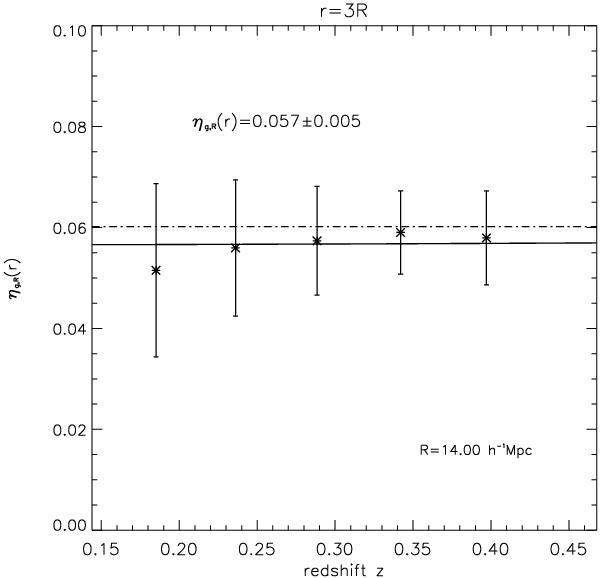
Redshift-space galaxy clustering ratio ηg,R(nR) extracted from the LasDamas simulations (see Sect. 4) using R = 14 h-1 Mpc and n = 3 shown as a function of redshift. Markers represent the average measurement from 40 LasDamas mock catalogues, each of them simulating a redshift survey that has the same radial density profile and observational selection effects as the LRG sample of SDSS DR7. Simulated observations are compared to the predicted amplitudes of the real-space mass clustering ratio ηR(nR) (right-hand side of Eq. (21)). Dashed lines show predictions computed using a linear power spectrum, while solid lines are derived assuming the non-linear (halofit) model of Smith et al. (2003). Both the galaxy and mass clustering ratios are estimated by adopting the same cosmological parameters as the LasDamas simulations. Error bars represent the uncertainty from measurements in a single mock catalogue. They are obtained as the standard deviation of 40 independent measurements, therefore including the contribution due to cosmic variance.
Current usage metrics show cumulative count of Article Views (full-text article views including HTML views, PDF and ePub downloads, according to the available data) and Abstracts Views on Vision4Press platform.
Data correspond to usage on the plateform after 2015. The current usage metrics is available 48-96 hours after online publication and is updated daily on week days.
Initial download of the metrics may take a while.