Fig. 9
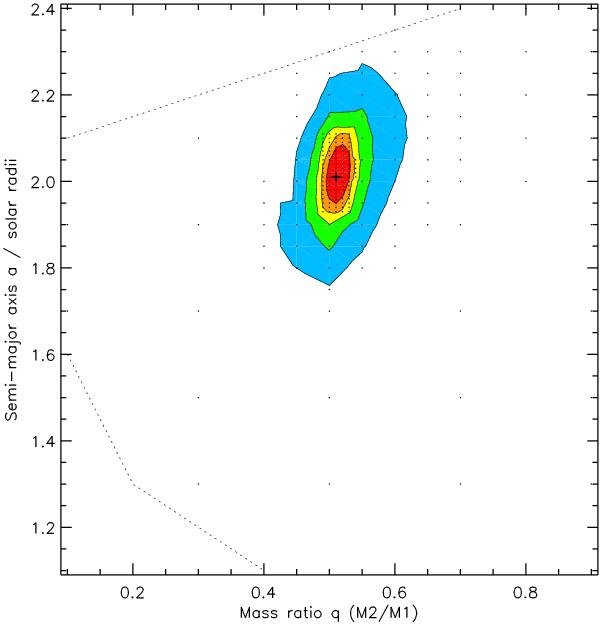
a–q parameter cross-section for J150822. Boxes indicate points sampled (other parameters are optimized) and the global minimum is marked with a cross. Contour lines show the 1, 2, 3, 4, and 5σ uncertainty levels derived from the Δχ2 values of the sampled points. Points outside the plot boundaries or the dotted lines were not sampled since they corresponded to physically implausible masses for the stellar components (<0.08 or >1.5 M⊙).
Current usage metrics show cumulative count of Article Views (full-text article views including HTML views, PDF and ePub downloads, according to the available data) and Abstracts Views on Vision4Press platform.
Data correspond to usage on the plateform after 2015. The current usage metrics is available 48-96 hours after online publication and is updated daily on week days.
Initial download of the metrics may take a while.