Fig. 7
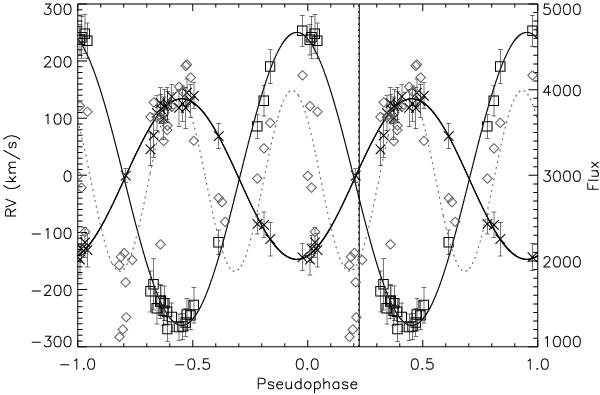
Radial velocities for J150822 (crosses indicate primary component, squares secondary) with preliminary fits (solid curves) used to obtain correct phasing of observations. Also shown are a light curve obtained from the spectra themselves (grey diamonds, fitted with dotted grey curve) and the predictions for time of minimum light from SuperWASP ephemerides (the solid vertical line indicates a linear ephemeris, i.e. no period change, the dotted vertical line a quadratic one, i.e. secular period change; the two are almost coincident).
Current usage metrics show cumulative count of Article Views (full-text article views including HTML views, PDF and ePub downloads, according to the available data) and Abstracts Views on Vision4Press platform.
Data correspond to usage on the plateform after 2015. The current usage metrics is available 48-96 hours after online publication and is updated daily on week days.
Initial download of the metrics may take a while.