Fig. 2
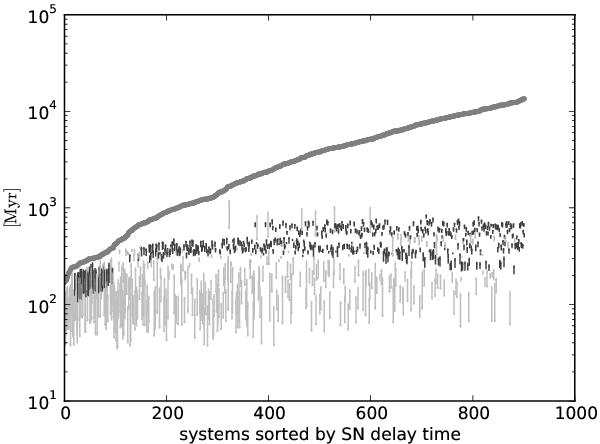
Accretion history for detached, purely wind-accreting systems (i.e. systems that never experience stable mass transfer) in the optimistic case, using the γ-CE formulation. The y-axis gives the delay time from formation of the system until the SN explosion. Each column in the plot corresponds to one system, and the systems are ordered according to delay time, with delay times increasing towards the right; the dark grey line delineates the SN explosions. Light grey vertical lines show accretion events in systems where the initially most massive star is the accretor, black is for systems where the initially least massive star is the accretor. Compare with Figs. 1 and 3.
Current usage metrics show cumulative count of Article Views (full-text article views including HTML views, PDF and ePub downloads, according to the available data) and Abstracts Views on Vision4Press platform.
Data correspond to usage on the plateform after 2015. The current usage metrics is available 48-96 hours after online publication and is updated daily on week days.
Initial download of the metrics may take a while.