Fig. 8
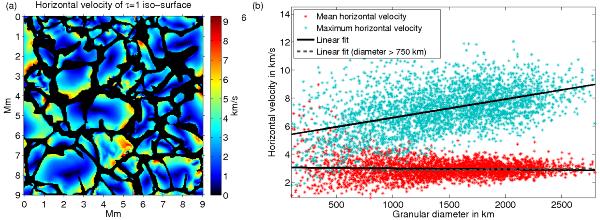
a) Application of the segmentation mask to the horizontal velocity on the τ1-iso-surface for a single frame. b) Scatter plot of granular diameter vs. mean horizontal velocity of segmented granules for the entire time series, shown in red and the maximum horizontal velocity in blue. The trends for granules across the whole range of diameters are illustrated by linear fits as solid black lines and for granules with diameters larger than 750 km by a linear fit as a dashed dark-gray line (only shown for the mean horizontal velocity).
Current usage metrics show cumulative count of Article Views (full-text article views including HTML views, PDF and ePub downloads, according to the available data) and Abstracts Views on Vision4Press platform.
Data correspond to usage on the plateform after 2015. The current usage metrics is available 48-96 hours after online publication and is updated daily on week days.
Initial download of the metrics may take a while.