Fig. 4
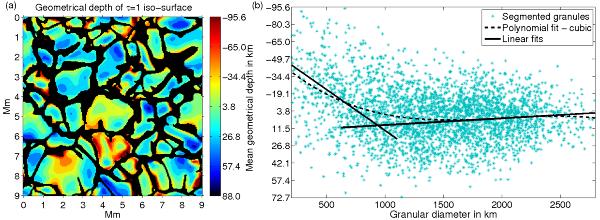
a) Application of the segmentation mask to the geometrical depth of the iso-surface of τ = 1 for a single frame. Red indicates the location below the calculated iso-surface of τ = 1 in the convection zone and blue the location above this calculated level. b) Granular diameter vs. the mean geometrical depth where τ = 1 for the entire time series. The trend of the scatter is illustrated by linear fits (solid black lines) and a third-order polynomial fit (dashed dark-gray line).
Current usage metrics show cumulative count of Article Views (full-text article views including HTML views, PDF and ePub downloads, according to the available data) and Abstracts Views on Vision4Press platform.
Data correspond to usage on the plateform after 2015. The current usage metrics is available 48-96 hours after online publication and is updated daily on week days.
Initial download of the metrics may take a while.