Fig. 1
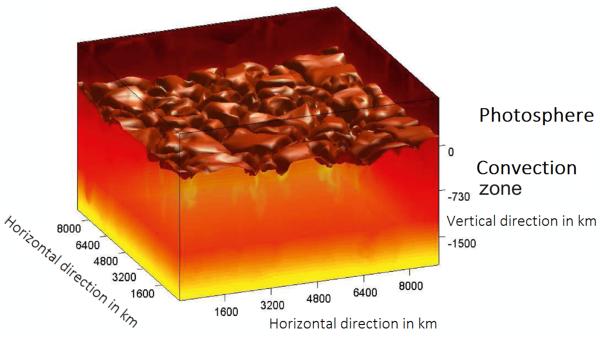
Snapshot of the simulated data computed by the ANTARES code during a 3D RHD run. In this model, the temperature data are color coded. Moreover, a temperature iso-surface of 6000 K, located at a height of ~750 km below the upper boundary, indicates the granular pattern. An artificial light source was placed above the model to accentuate the structure of iso-surface.
Current usage metrics show cumulative count of Article Views (full-text article views including HTML views, PDF and ePub downloads, according to the available data) and Abstracts Views on Vision4Press platform.
Data correspond to usage on the plateform after 2015. The current usage metrics is available 48-96 hours after online publication and is updated daily on week days.
Initial download of the metrics may take a while.