Fig. 4
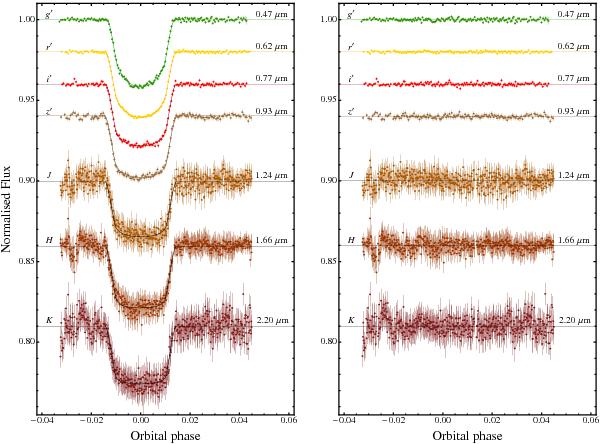
Left-hand panel: simultaneous optical and NIR light curves of the transit event of WASP-80 b observed with GROND. The jktebop best fits are shown as solid lines for each data set. The passbands are labelled on the left of the figure, and their central wavelengths are given on the right. Right-hand panel: residuals of each fit.
Current usage metrics show cumulative count of Article Views (full-text article views including HTML views, PDF and ePub downloads, according to the available data) and Abstracts Views on Vision4Press platform.
Data correspond to usage on the plateform after 2015. The current usage metrics is available 48-96 hours after online publication and is updated daily on week days.
Initial download of the metrics may take a while.