Free Access
Fig. 6
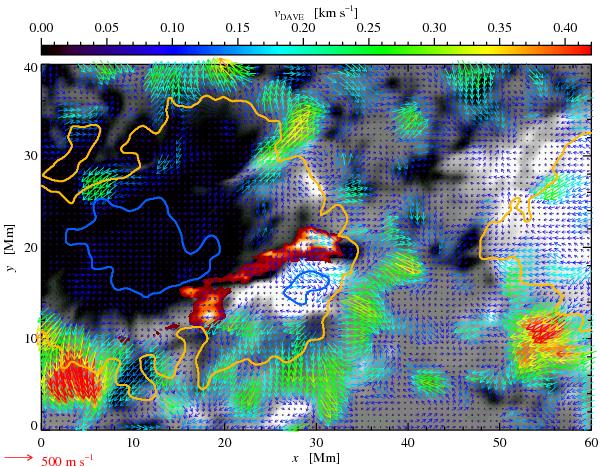
One-hour averaged HMI magnetogram (clipped to ±500 G in gray scale) with superimposed vectors of vDAVE. Length (see arrow below the figure) and color of the vectors represent the magnitude of vDAVE. Emission along the CEL is indicated by the red background.
Current usage metrics show cumulative count of Article Views (full-text article views including HTML views, PDF and ePub downloads, according to the available data) and Abstracts Views on Vision4Press platform.
Data correspond to usage on the plateform after 2015. The current usage metrics is available 48-96 hours after online publication and is updated daily on week days.
Initial download of the metrics may take a while.