Fig. 2
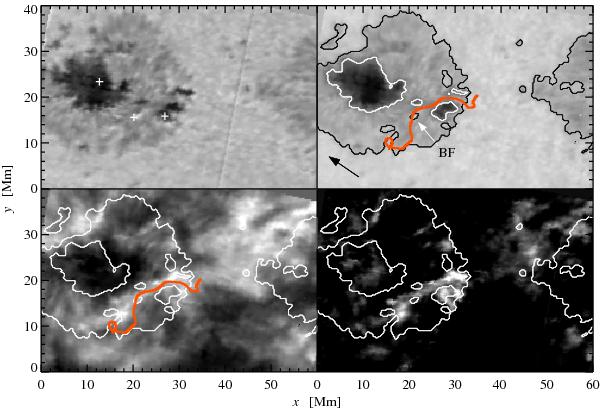
Maps of continuum intensities at λ1078 and λ854 nm, Ca iiλ854.2 nm line-core intensity, and maximum of the central Ca ii emission (top-left to bottom right). The ordinate is along the solar north-south direction. The black arrow points toward the disk center, and the white arrow indicates the bright feature BF near the PIL (thick red line). Contour lines denote the umbral and penumbral boundaries. Three white crosses mark the positions of the spectral profiles in Fig. 3.
Current usage metrics show cumulative count of Article Views (full-text article views including HTML views, PDF and ePub downloads, according to the available data) and Abstracts Views on Vision4Press platform.
Data correspond to usage on the plateform after 2015. The current usage metrics is available 48-96 hours after online publication and is updated daily on week days.
Initial download of the metrics may take a while.