Free Access
Fig. 4
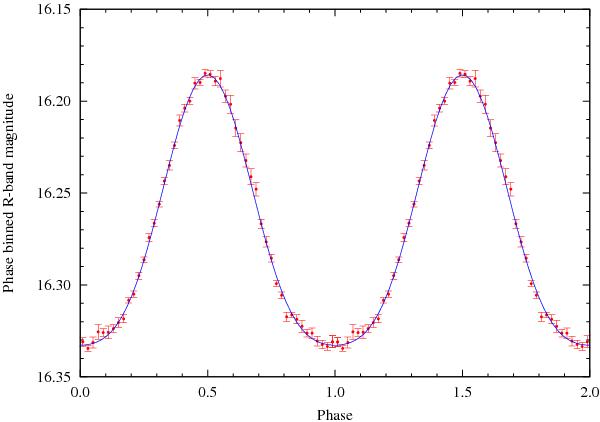
Phase-binned light curve of HS 2043+0615. The 516 MEROPE data points from 2007 were phase-folded on P = 0.30156 day using 50 bins, and are plotted twice to better visualise the difference in width of the peaks and throughs. The error bars indicate the rms for each phase bin.
Current usage metrics show cumulative count of Article Views (full-text article views including HTML views, PDF and ePub downloads, according to the available data) and Abstracts Views on Vision4Press platform.
Data correspond to usage on the plateform after 2015. The current usage metrics is available 48-96 hours after online publication and is updated daily on week days.
Initial download of the metrics may take a while.