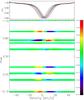
Fig. 3
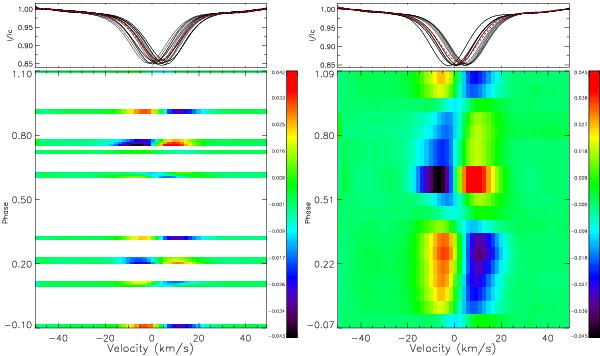
Top: Narval LSD I profiles. The mean profile is shown with a dashed red line. Bottom: dynamical plot of the residuals of the LSD I profiles compared to the mean LSD I profile, folded in phase with the ephemeris of BP07 (left) and with the same HJD0 but the main pulsation period Ppuls = 0.15175 d (right). The profiles have been rebinned in bins of 0.01 for the period of BP07 and 0.06 for the pulsation period.
Current usage metrics show cumulative count of Article Views (full-text article views including HTML views, PDF and ePub downloads, according to the available data) and Abstracts Views on Vision4Press platform.
Data correspond to usage on the plateform after 2015. The current usage metrics is available 48-96 hours after online publication and is updated daily on week days.
Initial download of the metrics may take a while.