Free Access
Fig. 1
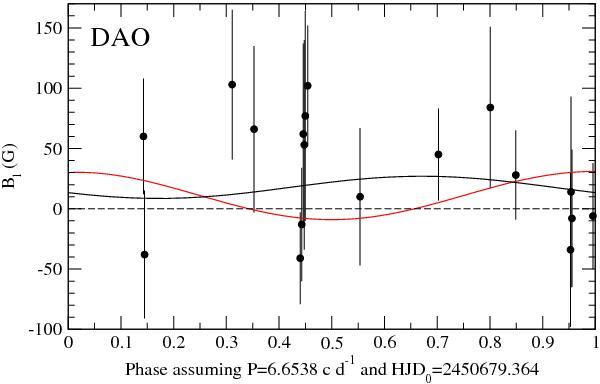
Longitudinal field measurements from the Hβ line observed with DAO. The black solid line shows the best sinusoidal dipole fit to the data, the dashed line shows a null field, and the red solid line shows the sinusoidal variation expected from BP07.
Current usage metrics show cumulative count of Article Views (full-text article views including HTML views, PDF and ePub downloads, according to the available data) and Abstracts Views on Vision4Press platform.
Data correspond to usage on the plateform after 2015. The current usage metrics is available 48-96 hours after online publication and is updated daily on week days.
Initial download of the metrics may take a while.