Fig. 2
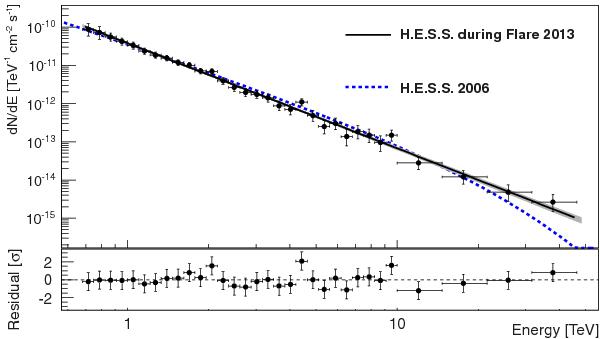
Crab photon spectrum. Black circles indicate the H.E.S.S. Crab nebula data taken in the nights from March 6 to March 10, 2013 with 1σ error bars on the flux in the respective bin. The black line and the grey shaded area are the fitted power law model and the corresponding 1σ error butterfly. The blue dashed line corresponds to the spectrum reported in Aharonian et al. (2006).
Current usage metrics show cumulative count of Article Views (full-text article views including HTML views, PDF and ePub downloads, according to the available data) and Abstracts Views on Vision4Press platform.
Data correspond to usage on the plateform after 2015. The current usage metrics is available 48-96 hours after online publication and is updated daily on week days.
Initial download of the metrics may take a while.