Fig. 1
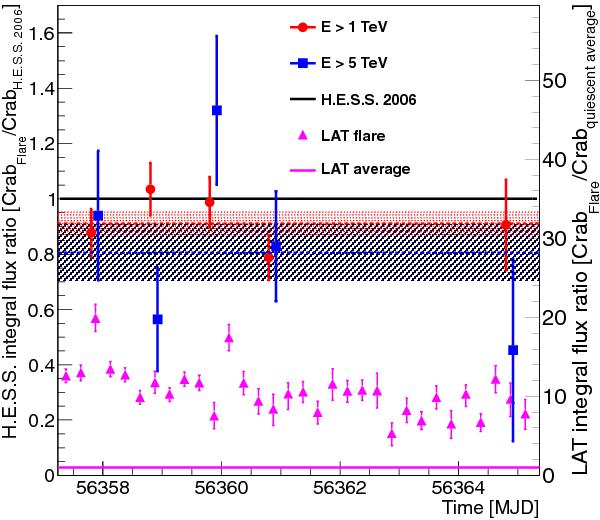
Night-wise light curves for energy thresholds of 1 and 5 TeV. Red squares indicate integral fluxes > 1 TeV relative to the integral flux above 1 TeV obtained from Aharonian et al. (2006). Error bars depict 1σ statistical errors. The dashed red line is the fit of a constant to this light curve, and the hatched red area marks the 1σ statistical error. The equivalent data for an energy threshold of 5 TeV are presented in blue. For reference, the Fermi-LAT synchrotron light curve as published in Mayer et al. (2013) is shown in magenta. Each bin corresponds to 6 h of observations. The flux is scaled to the average quiescent synchrotron photon flux as reported in Buehler et al. (2012) ((6.1 ± 0.2) × 10-7 cm-2 s-1).
Current usage metrics show cumulative count of Article Views (full-text article views including HTML views, PDF and ePub downloads, according to the available data) and Abstracts Views on Vision4Press platform.
Data correspond to usage on the plateform after 2015. The current usage metrics is available 48-96 hours after online publication and is updated daily on week days.
Initial download of the metrics may take a while.