Fig. 5
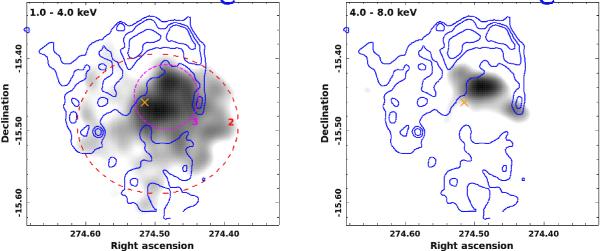
Smoothed (Gaussian kernel with 0.01° sigma), exposure-corrected images of diffuse X-ray emission in two energy bands (as indicated in the figures). The color scale is linear between the threshold, as defined in the text, and the maximum pixel intensity. The 90 cm radio contours of G 15.4+0.1 are overplotted (blue). The dashed lines indicate the regions used for spectral analysis. The cross (orange) indicates the best-fit position of HESS J1818−154.
Current usage metrics show cumulative count of Article Views (full-text article views including HTML views, PDF and ePub downloads, according to the available data) and Abstracts Views on Vision4Press platform.
Data correspond to usage on the plateform after 2015. The current usage metrics is available 48-96 hours after online publication and is updated daily on week days.
Initial download of the metrics may take a while.