Free Access
Fig. 3
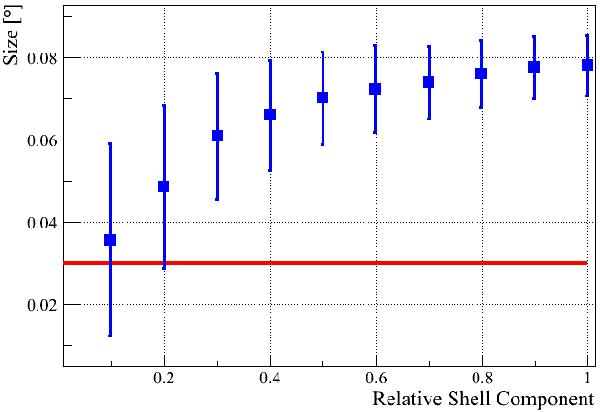
Reconstructed Gaussian size for the combined TeV emission from a point-like and a shell-type source (blue datapoints). The x-axis indicates the relative contribution from the shell component to the total flux. The red line indicates the non-significant, best-fit extension of HESS J1818−154.
Current usage metrics show cumulative count of Article Views (full-text article views including HTML views, PDF and ePub downloads, according to the available data) and Abstracts Views on Vision4Press platform.
Data correspond to usage on the plateform after 2015. The current usage metrics is available 48-96 hours after online publication and is updated daily on week days.
Initial download of the metrics may take a while.