Free Access
Fig. 2
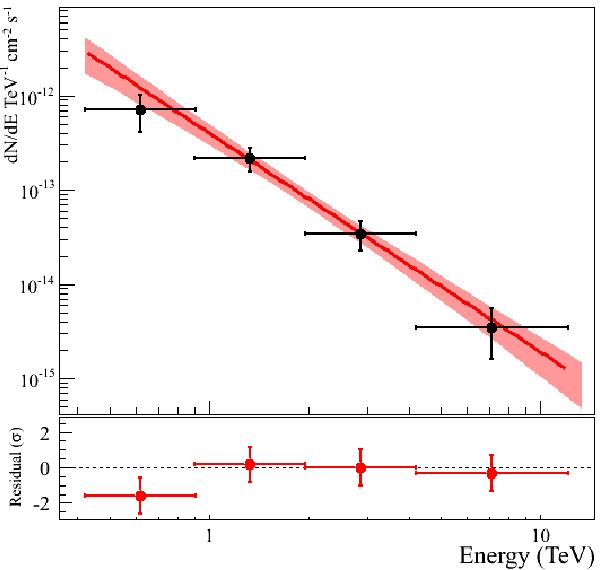
Differential VHE γ-ray spectrum of HESS J1818−154. The error bars represent 1σ statistical errors. The result of a power-law fit to the spectral data points is also shown, together with the 1σ error band. The residuals between the power-law fit and the datapoints are shown in the bottom plot.
Current usage metrics show cumulative count of Article Views (full-text article views including HTML views, PDF and ePub downloads, according to the available data) and Abstracts Views on Vision4Press platform.
Data correspond to usage on the plateform after 2015. The current usage metrics is available 48-96 hours after online publication and is updated daily on week days.
Initial download of the metrics may take a while.