Fig. 1
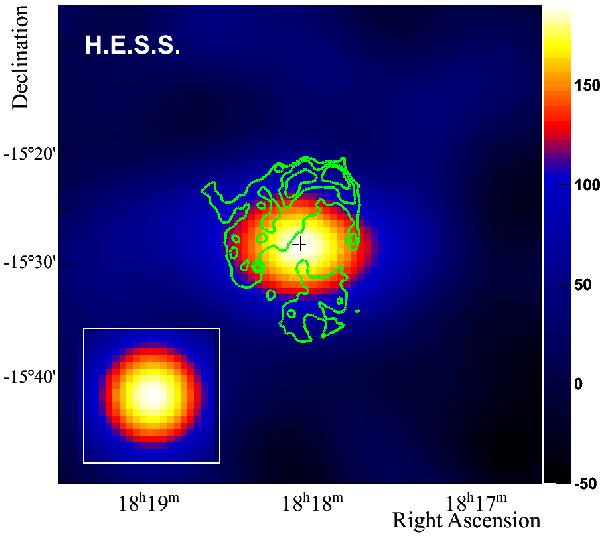
VHE γ-ray excess around the SNR G 15.4+0.1. The image has been corrected for the varying exposure across the FoV and has been smoothed with a 2D Gaussian with a width of 0.06°. The H.E.S.S. PSF for this analysis is shown in the bottom left inset. The color scale is chosen such that the blue-red transition occurs at roughly 4σ significance. The best-fit centroid of the γ-ray excess is indicated by a cross, the size of which corresponds to the sum of both statistical and systematic uncertainties. The green contours show the intensity (at 0.0175, 0.035 and 0.0525 Jy beam-1) of the radio emission from the SNR shell, based on 90-cm VLA observations (Brogan et al. 2006).
Current usage metrics show cumulative count of Article Views (full-text article views including HTML views, PDF and ePub downloads, according to the available data) and Abstracts Views on Vision4Press platform.
Data correspond to usage on the plateform after 2015. The current usage metrics is available 48-96 hours after online publication and is updated daily on week days.
Initial download of the metrics may take a while.