Fig. 6
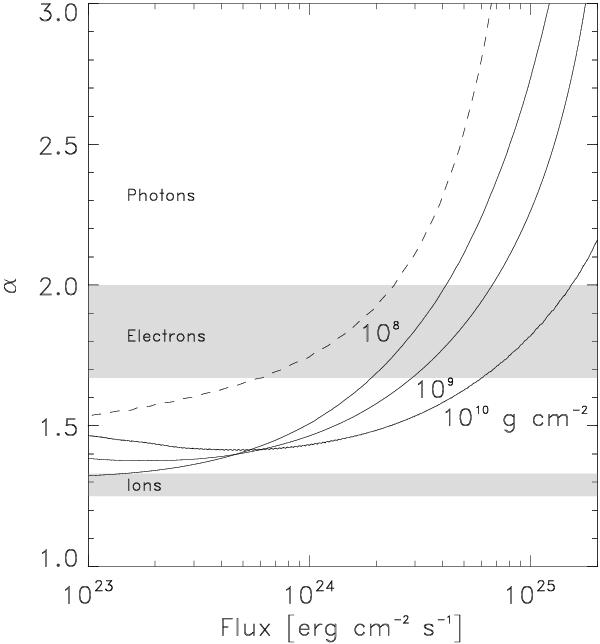
The light curve slope as a function of flux as calculated in multizone models of a cooling layer (solid curves) with column depths y = 108, 109, and 1010 g cm-2. For comparison we show the one-zone model result for y = 108 g cm-2 as the dashed curve. The gray areas show the expected range of values of α when ions dominate the heat capacity or when electrons dominate the heat capacity, taking the cooling to lie between L ∝ T4 and L ∝ T5.
Current usage metrics show cumulative count of Article Views (full-text article views including HTML views, PDF and ePub downloads, according to the available data) and Abstracts Views on Vision4Press platform.
Data correspond to usage on the plateform after 2015. The current usage metrics is available 48-96 hours after online publication and is updated daily on week days.
Initial download of the metrics may take a while.