Fig. 3
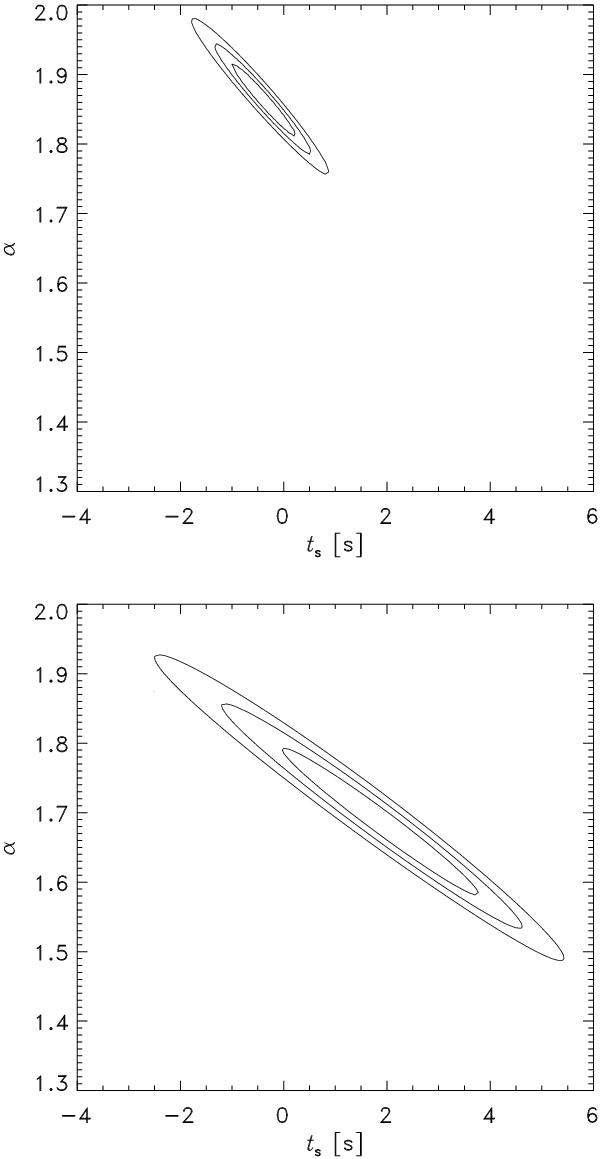
Contours of goodness of fit  for a power-law fit to the bolometric flux data for the burst from 0918-549 (upper plot) and burst number 2 from SAX J1808.4-3658 (lower) as a function of ts and α. Three contours are drawn, for
  with Δχ2 = 1.0,2.3 and 4.6 (i.e., not per degree of freedom). The first contour delimits the single parameter 1σ region. The second and third contour delimit the 68% and 90% confidence regions. The contours show a coupling between both parameters.
Current usage metrics show cumulative count of Article Views (full-text article views including HTML views, PDF and ePub downloads, according to the available data) and Abstracts Views on Vision4Press platform.
Data correspond to usage on the plateform after 2015. The current usage metrics is available 48-96 hours after online publication and is updated daily on week days.
Initial download of the metrics may take a while.