Fig. 3
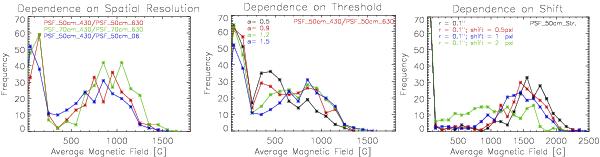
Dependence of distributions on observational and methodological effects. Left: distribution of the average field of features identified assuming α = 1.5 in G-band images and B0 degraded with different PSFs (see legend). Middle: distribution of the average field of features identified assuming different α values (see legend) in both G-band and B0 images degraded with the indicated PSFs. Right: distribution of the average magnetic field of features identified assuming α = 1.5 in G-band images of 0.1′′ spatial sampling degraded assuming the indicated PSF, and B0 shifted in the x-direction (see legend).
Current usage metrics show cumulative count of Article Views (full-text article views including HTML views, PDF and ePub downloads, according to the available data) and Abstracts Views on Vision4Press platform.
Data correspond to usage on the plateform after 2015. The current usage metrics is available 48-96 hours after online publication and is updated daily on week days.
Initial download of the metrics may take a while.