Fig. 1
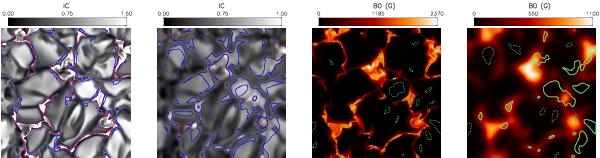
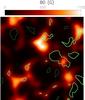
Left: G-band contrast IC of one of the MHD snapshots, saturated at 1.5. Dotted blue lines: borders of regions where 1 hG <B0 < 1 kG. Solid blue lines: regions where 1 hG <B0 < 1 kG and IC ≥ 1. Solid red lines: regions where B0 ≥ 1 kG. Middle left: same as left panel, but image degraded with a PSF_50cm_430. Middle Right: B0 corresponding to left panel. Right: B0 convolved with a PSF_50cm_06. Dotted green lines denote contours of features identified in images in the left and middle-left panels, respectively, assuming α = 1.5; solid green lines denote borders of a subset of identified features whose average field value is between 1 hG and 1 kG.
Current usage metrics show cumulative count of Article Views (full-text article views including HTML views, PDF and ePub downloads, according to the available data) and Abstracts Views on Vision4Press platform.
Data correspond to usage on the plateform after 2015. The current usage metrics is available 48-96 hours after online publication and is updated daily on week days.
Initial download of the metrics may take a while.