Fig. A.1
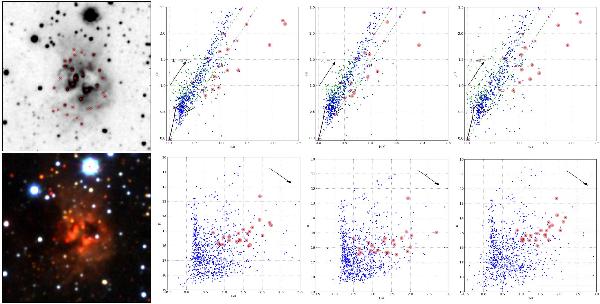
Cluster candidate 11. The 1′ by 1′ false colour image of the cluster candidate is shown below the greyscale image. Image orientation is north up and east left. All the sources within a 4′ by 4′ box around the cluster candidate are plotted in the (H − K,J − H) colour−colour and (H − K,K) colour−magnitude plots. In the colour−colour plot blue dots are sources brighter than 17m and green dots fainter than 17m in Ks. The colour−colour and colour−magnitude diagrams, from left to right, are plotted using the AperMag3, AperMag1, and the AperMag4 magnitudes, respectively. The red crosses in the 1′ by 1′ greyscale image and the the red filled circles in the colour plots are sources (both stellar and non-stellar) in the cluster direction brighter than 17m in Ks.
Current usage metrics show cumulative count of Article Views (full-text article views including HTML views, PDF and ePub downloads, according to the available data) and Abstracts Views on Vision4Press platform.
Data correspond to usage on the plateform after 2015. The current usage metrics is available 48-96 hours after online publication and is updated daily on week days.
Initial download of the metrics may take a while.