Fig. C.1
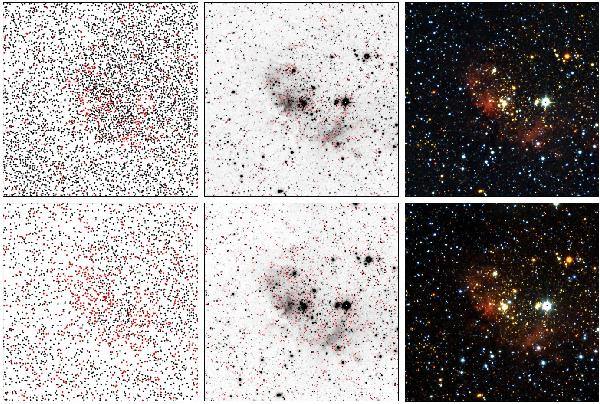
Clusters [BDS2003] 113 in the centre and [BDS2003] 112 1.1′ south-west from the centre. In the upper row are the images and plots from UKIDSS and in the lower row from VVV. In the first column are the catalogue plots, in the middle column the corresponding K-band image, and in the right column false colour images produced from J, H, and K-band images. Image orientation is north up and east left. Image size is 4′ by 4′. Plot markers (dots and crosses) are as in Fig. B.1.
Current usage metrics show cumulative count of Article Views (full-text article views including HTML views, PDF and ePub downloads, according to the available data) and Abstracts Views on Vision4Press platform.
Data correspond to usage on the plateform after 2015. The current usage metrics is available 48-96 hours after online publication and is updated daily on week days.
Initial download of the metrics may take a while.