Fig. 7
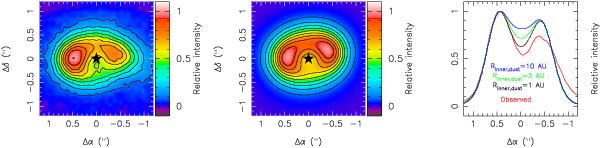
Left and center panels: observed and modeled VLT-VISIR 18.7 μm images. Contour lines show 10,20,...% of the peak emission. Right panel: cut through the observed and modeled images (Δδ = 0). Red line: observed intensity. Black, green, and blue lines: modeled intensities for different outer radii of the warm dust inner disk (Rinner,dust = 1,3, or 10 AU).
Current usage metrics show cumulative count of Article Views (full-text article views including HTML views, PDF and ePub downloads, according to the available data) and Abstracts Views on Vision4Press platform.
Data correspond to usage on the plateform after 2015. The current usage metrics is available 48-96 hours after online publication and is updated daily on week days.
Initial download of the metrics may take a while.