Free Access
Fig. 4
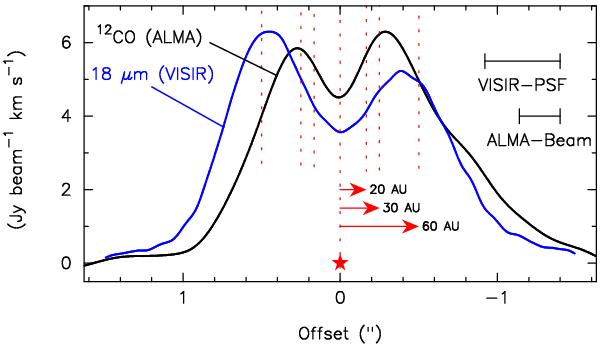
Integrated intensity of 12CO J = 6−5 (black line) extracted from a cut through the major axis of the disk (y = 0 AU in Fig. 1b). The 18.7 μm dust emission observed by VLT-VISIR (blue line) has been scaled to the 12CO peak.
Current usage metrics show cumulative count of Article Views (full-text article views including HTML views, PDF and ePub downloads, according to the available data) and Abstracts Views on Vision4Press platform.
Data correspond to usage on the plateform after 2015. The current usage metrics is available 48-96 hours after online publication and is updated daily on week days.
Initial download of the metrics may take a while.