Fig. 3
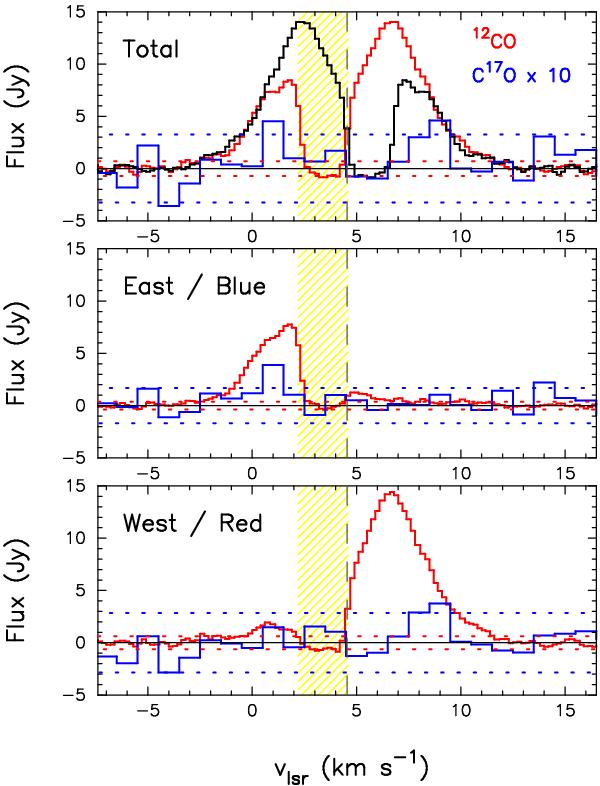
Continuum-subtracted spectra of 12CO J = 6−5 (red lines) and 17CO J = 6−5 (blue lines). The spectra are extracted from regions with >5σ detections in 12CO. The yellow shaded region indicates velocities affected by foreground absorption. The vertical dashed line at 4.55 km s-1 gives vsource. Dotted horizontal lines show the 3σ detection level. Top panel: total spectrum. The spectrum of 12CO mirrored on vsource is given in black line. Center panel: spectrum extracted from the east/blue part of the disk. Bottom panel: spectrum extracted from the west/red part of the disk.
Current usage metrics show cumulative count of Article Views (full-text article views including HTML views, PDF and ePub downloads, according to the available data) and Abstracts Views on Vision4Press platform.
Data correspond to usage on the plateform after 2015. The current usage metrics is available 48-96 hours after online publication and is updated daily on week days.
Initial download of the metrics may take a while.