Fig. 14
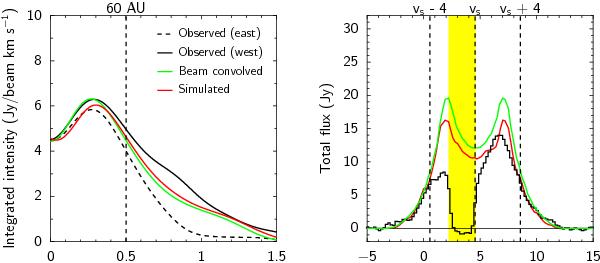
Comparison of the intensity profile and total spectrum of the representative model convolved to the ALMA beam or simulated using the observed (u, v)-coverage. Left panel: intensity profile extracted along the major axis of the disk. The vertical dashed line indicates the radius of the dust-free cavity. Right panel: total spectrum. The yellow region indicates regions affected by the foreground. Vertical dashed lines show the source velocity vs = 4.55 km s-1 and velocities vs ± 4 km s-1 representing velocity ranges corresponding to the inner disk (radii ≲60 AU).
Current usage metrics show cumulative count of Article Views (full-text article views including HTML views, PDF and ePub downloads, according to the available data) and Abstracts Views on Vision4Press platform.
Data correspond to usage on the plateform after 2015. The current usage metrics is available 48-96 hours after online publication and is updated daily on week days.
Initial download of the metrics may take a while.