Fig. 1
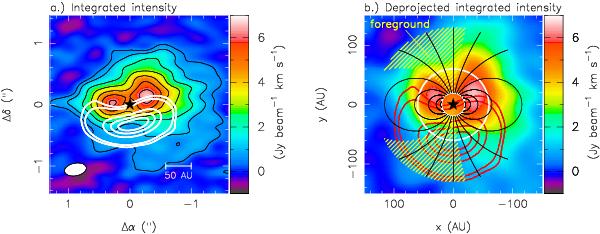
a) Continuum-subtracted integrated intensity of 12CO J = 6−5 in color. The black contour lines show 5σ,10σ,20σ,... detections of the line (1σ = 73 mJy beam-1 km s-1), white contour lines represent 5σ,10σ,100σ,200σ,300σ detections of the continuum (1σ = 0.82 mJy beam-1). The ALMA beam (FWHM) is indicated in the lower left corner. b) Deprojected continuum-subtracted integrated intensity maps of 12CO J = 6−5 in color and continuum with red contour (5σ,10σ,100σ,200σ,300σ detections). The (x,y)-coordinates are along the major/minor axis of the observed disk. Thick white lines indicate radii of 20 and 60 AU and deprojected isovelocity contours of regions with velocity ± 1, ± 2,... km s-1 relative to vlsr towards us. The yellow shaded region indicates positions affected by foreground absorption.
Current usage metrics show cumulative count of Article Views (full-text article views including HTML views, PDF and ePub downloads, according to the available data) and Abstracts Views on Vision4Press platform.
Data correspond to usage on the plateform after 2015. The current usage metrics is available 48-96 hours after online publication and is updated daily on week days.
Initial download of the metrics may take a while.