Fig. 8
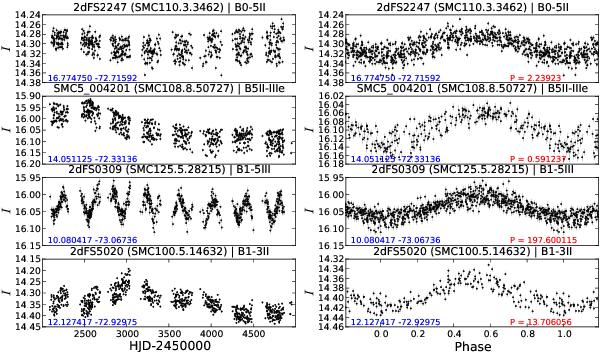
I-band light curves (left) of 4 periodic variables flagged as “short”, “short with extra variability”, “long”, and “long with extra variability”, respectively. These are folded to their derived periods (right). In this sample, the folded light curves of SMC5_004201 and 2dFS5020, which exhibit extra variability, correspond to the HJD ranges 2 454 000−2 455 000 and 2 454 200−2 455 000, respectively.
Current usage metrics show cumulative count of Article Views (full-text article views including HTML views, PDF and ePub downloads, according to the available data) and Abstracts Views on Vision4Press platform.
Data correspond to usage on the plateform after 2015. The current usage metrics is available 48-96 hours after online publication and is updated daily on week days.
Initial download of the metrics may take a while.