Fig. 2
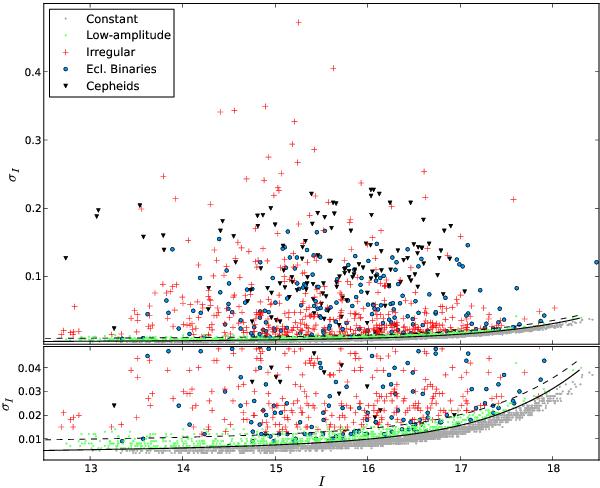
σI vs. I diagram for the 4646 stars studied in this work. The solid curve is used to separate real from spurious variables (as proposed by Graczyk & Eyer 2010), while the region between the solid and the dashed curves defines the low-amplitude variables. A zoomed-in region is presented in the lower panel. The irregular variables (crosses), the Cepheids (inverted triangles), and most of the EBs (open circles) lie above the dashed curve.
Current usage metrics show cumulative count of Article Views (full-text article views including HTML views, PDF and ePub downloads, according to the available data) and Abstracts Views on Vision4Press platform.
Data correspond to usage on the plateform after 2015. The current usage metrics is available 48-96 hours after online publication and is updated daily on week days.
Initial download of the metrics may take a while.