Fig. 16
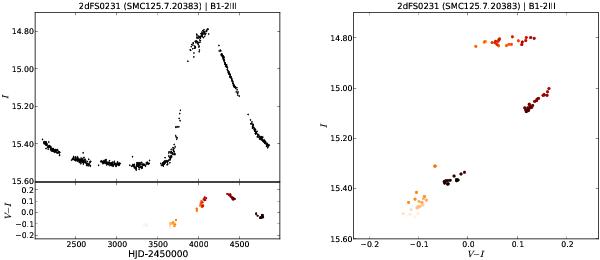
The left panel shows the I-band light curve (upper) and V − I color modulation (lower) of a bumper event exhibiting clockwise loop structure in the color–magnitude diagram, indicating outflowing material that accumulates in a disk that transits from an optically thick to optically thin state (de Wit et al. 2006). The right panel shows the color–magnitude diagram where the loop structure is demonstrated.
Current usage metrics show cumulative count of Article Views (full-text article views including HTML views, PDF and ePub downloads, according to the available data) and Abstracts Views on Vision4Press platform.
Data correspond to usage on the plateform after 2015. The current usage metrics is available 48-96 hours after online publication and is updated daily on week days.
Initial download of the metrics may take a while.