Fig. 13
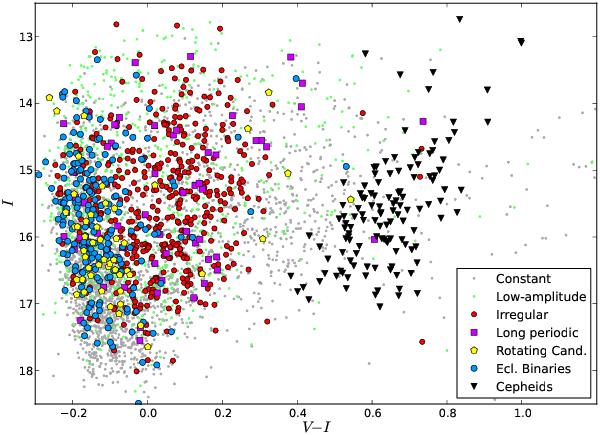
Color–magnitude diagram as in Fig. 1, but for the type of variability. The variability types labeled are constant stars (gray dots), low-amplitude variables (green dots), irregular variables (red circles), eclipsing binaries (blue circles), Cepheids (black triangles), long-periodic stars (P > 3 days; purple squares), and candidate rotating variables (yellow pentagons), as defined in Sect. 4. Short-periodic stars do not appear in this diagram for clarity.
Current usage metrics show cumulative count of Article Views (full-text article views including HTML views, PDF and ePub downloads, according to the available data) and Abstracts Views on Vision4Press platform.
Data correspond to usage on the plateform after 2015. The current usage metrics is available 48-96 hours after online publication and is updated daily on week days.
Initial download of the metrics may take a while.