Fig. 7
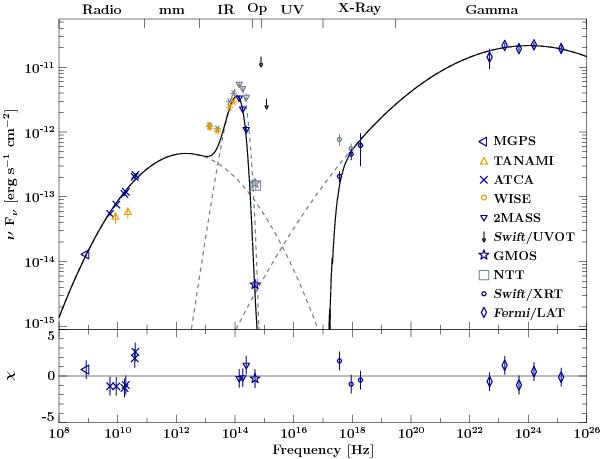
Broadband νFν SED including total fluxes of simultaneous TANAMI observations (of 2010 May), non-simultaneous measurements in the radio by the Molonglo Galactic Plane Survey (MGPS, Murphy et al. 2007), by ATCA (Stevens et al. 2012), by WISE (Wright et al. 2010) and 2MASS (Skrutskie et al. 2006), by GMOS and NTT (Shaw et al. 2013), by Swift/XRT, UVOT, and Fermi/LAT (2FGL, Nolan et al. 2012). The data are parametrized with two logarithmic parabolas absorbed by photoelectric absorption at X-ray energies with NH = 1.3 × 1022 cm-2 and an additional blackbody component (see Sect. 3.5 for details; χ2 = 23 for 12 degrees of freedom). Blue/Orange symbols mark the data used/ignored for the SED parametrization (solid black line) as described in Sect. 3.5. The IR and optical data are corrected for extinction (Fitzpatrick 1999; Nowak et al. 2012), and the X-ray data for absorption (Wilms et al. 2000, 2012; Verner et al. 1996), shown as corresponding gray symbols. The dashed gray lines represent the unabsorbed logarithmic parabolas as well as the extinction corrected blackbody component. The bottom panel shows the residuals of the fit in units of standard deviation of the individual data points.
Current usage metrics show cumulative count of Article Views (full-text article views including HTML views, PDF and ePub downloads, according to the available data) and Abstracts Views on Vision4Press platform.
Data correspond to usage on the plateform after 2015. The current usage metrics is available 48-96 hours after online publication and is updated daily on week days.
Initial download of the metrics may take a while.