Free Access
Fig. 4
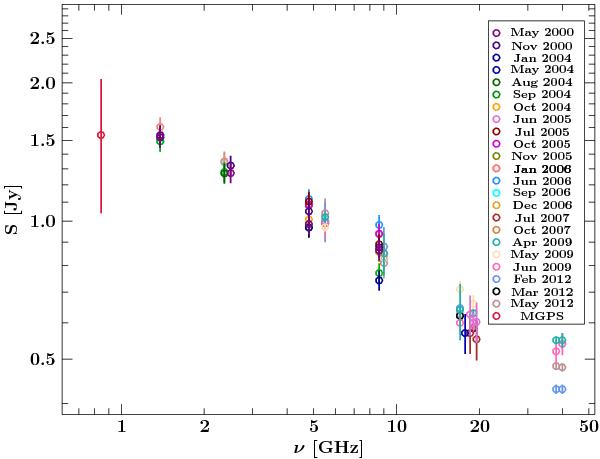
Radio spectrum of PMN J1603−4904 at 6 frequencies based on the ATCA monitoring. The error bars are calculated as a frequency-dependent fraction of the flux density at each frequency. The archival data of the MGPS catalog might indicate a turnover of the spectrum below 0.8 GHz.
Current usage metrics show cumulative count of Article Views (full-text article views including HTML views, PDF and ePub downloads, according to the available data) and Abstracts Views on Vision4Press platform.
Data correspond to usage on the plateform after 2015. The current usage metrics is available 48-96 hours after online publication and is updated daily on week days.
Initial download of the metrics may take a while.